Data Annex to the Conclusion No. 18/08 – Animal Production
 The SAO in Audit No. 18/08 analysed the data on animal production from the Farm Accountancy Data Network. This network serves as the main information source of the European Commission regarding the actual economic situation of agricultural holdings. FADN data come from a sample survey of agricultural entities and annually includes about 1,400 enterprises in the Czech Republic. The enterprises are grouped according to their production orientation and size.
In the analysis, the SAO used the following indicators of individual agricultural holdings:
- SE 020 Total labour input – the number of hours worked by paid workers.
- SE 080 Total livestock units – the average annual number of livestock converted to a livestock unit according to the EU methodology.
- SE 131 Total agricultural production – the sum of animal, plant and other production.
- SE 270 Total costs – the indicator consisting of the sum of direct costs, overhead costs, depreciation and external factors.
- SE 405 Balance of investment subsidies and taxes – consists of the sum of investment subsidies reduced by the VAT deductions on investments.
- SE 410 Gross value added – defined as the difference between the total agricultural production (animal, plant and other production) and production consumption (direct and overhead costs). The value includes the balance of operating subsidies and taxes.
- SE 415 Net value added – this indicator is based on the value of total production and all operating aids reduced by all costs, except for costs of external factors, i.e. except for labour costs, ground rent, rent for buildings and interest on loans. The net value added thus represents the company’s resources to cover costs of production factors.
- SE 420 Income from agricultural activities – profit or loss expressed as a net value added after deducting costs of external factors (labour costs, ground rent, rent for building and cost interest) and adding investment subsidies.
- SE 600 Balance of operating subsidies and taxes – the sum of operating subsidies and the VAT balance reduced by taxes.
- Operating subsidies – the sum of operating subsidies.
- Difference between total production and total costs – a positive indicator means that the production was higher than the costs.
Schema FADN EU
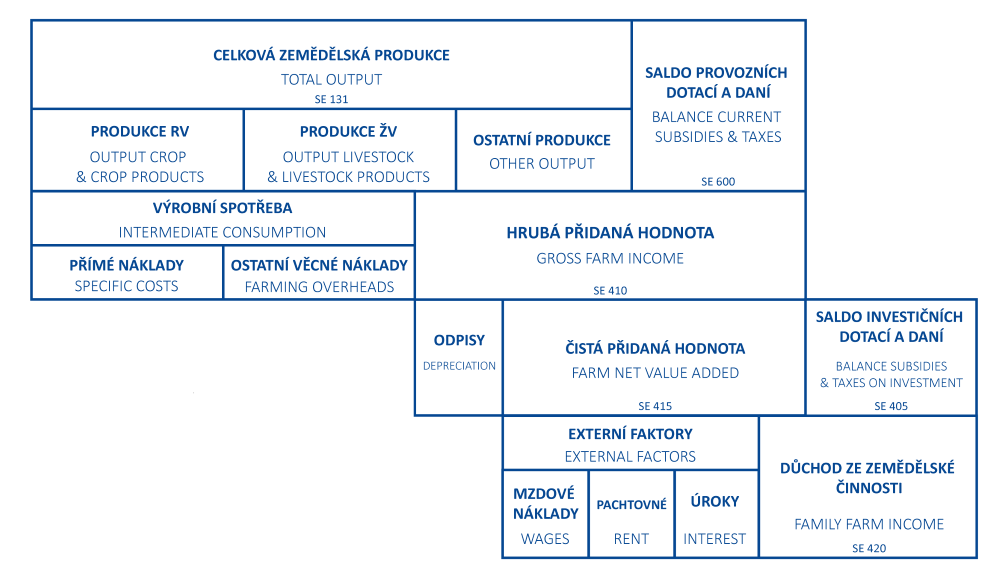
Source: FADN Czech Republic.
The data processed concern the period from 2004 to 2016. The analysis contains data from the European part of FADN, which serve as the basis for comparison between individual EU Member States or between a Member State and the EU average.
Data visualization - instructions
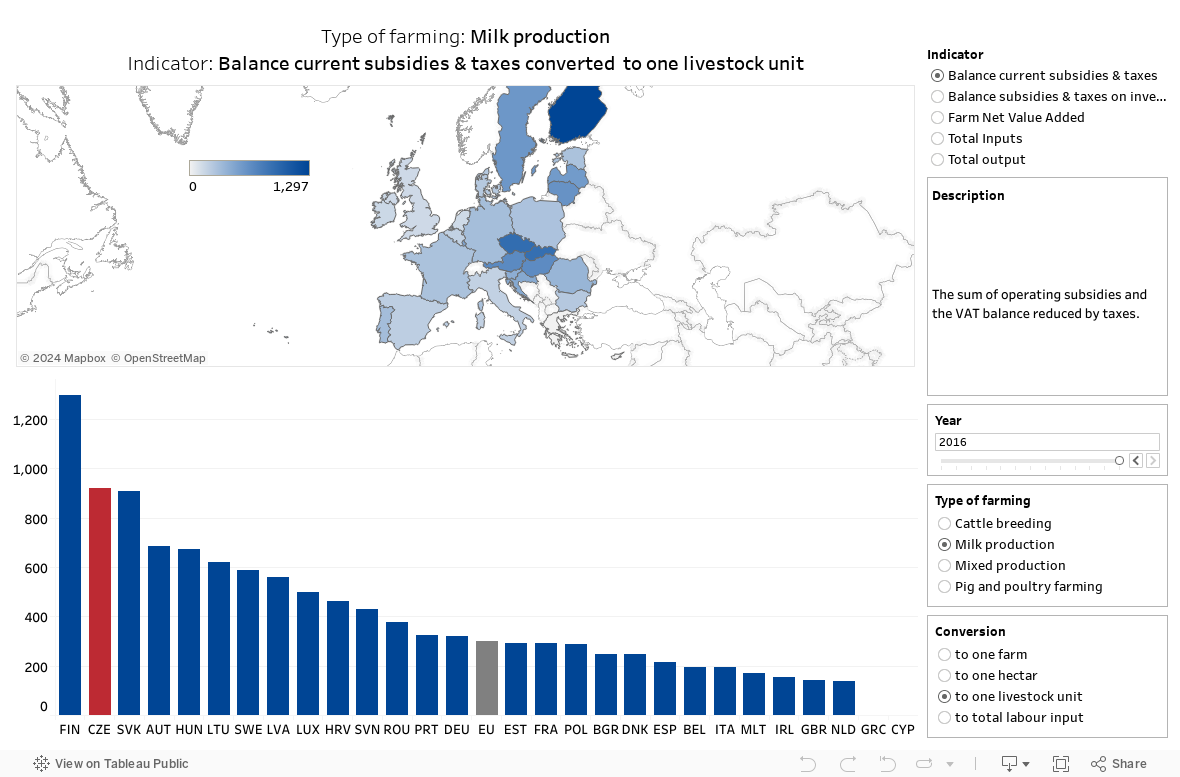
1. Comparison of Selected Indicators Among EU Member States
The first visualisation provides a graphical representation of indicators Balance of operating costs and taxes, Balance of investment taxes and subsidies, Total production, Total costs and Net value added, for individual years and EU Member States.
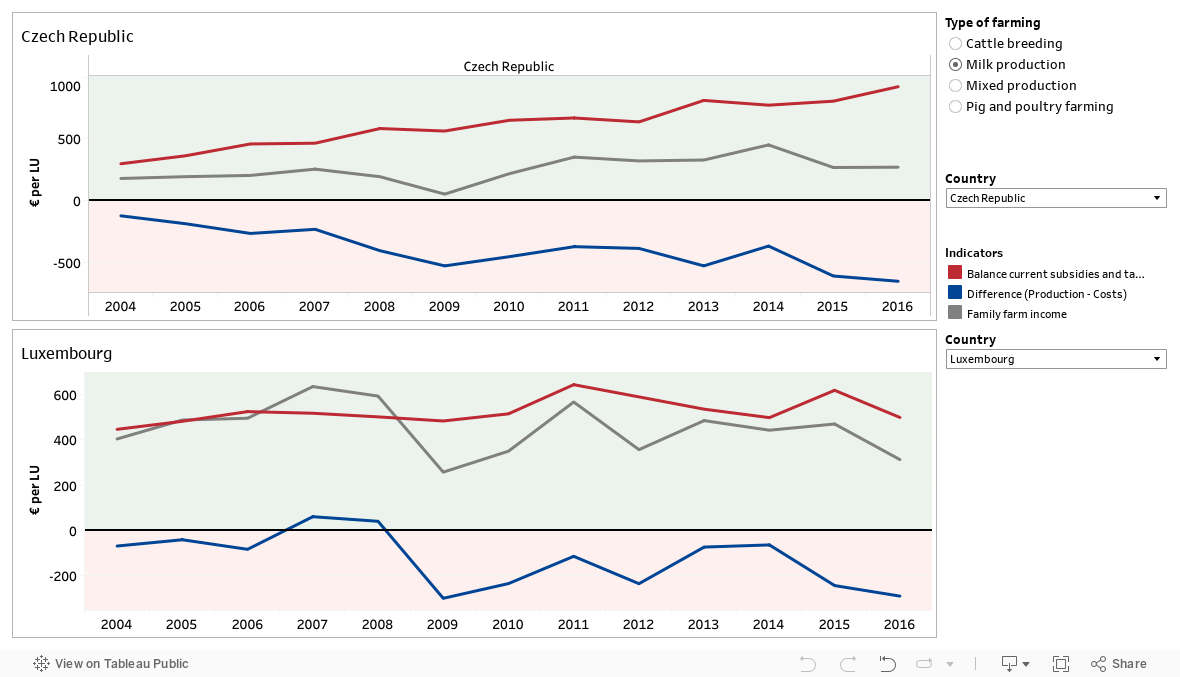
2. Development of Selected Indicators over Time
The second visualisation provides a graphical representation of indicators Balance of operating costs and taxes, Balance of investment taxes and subsidies, Total production, Total costs and Net value added, for individual years and EU Member States. Here, you can display values of indicators Balance of operating taxes and subsidies, Income from agricultural activities and Difference between total production and total costs and compare them between two EU Member States or between a Member State and the EU average.
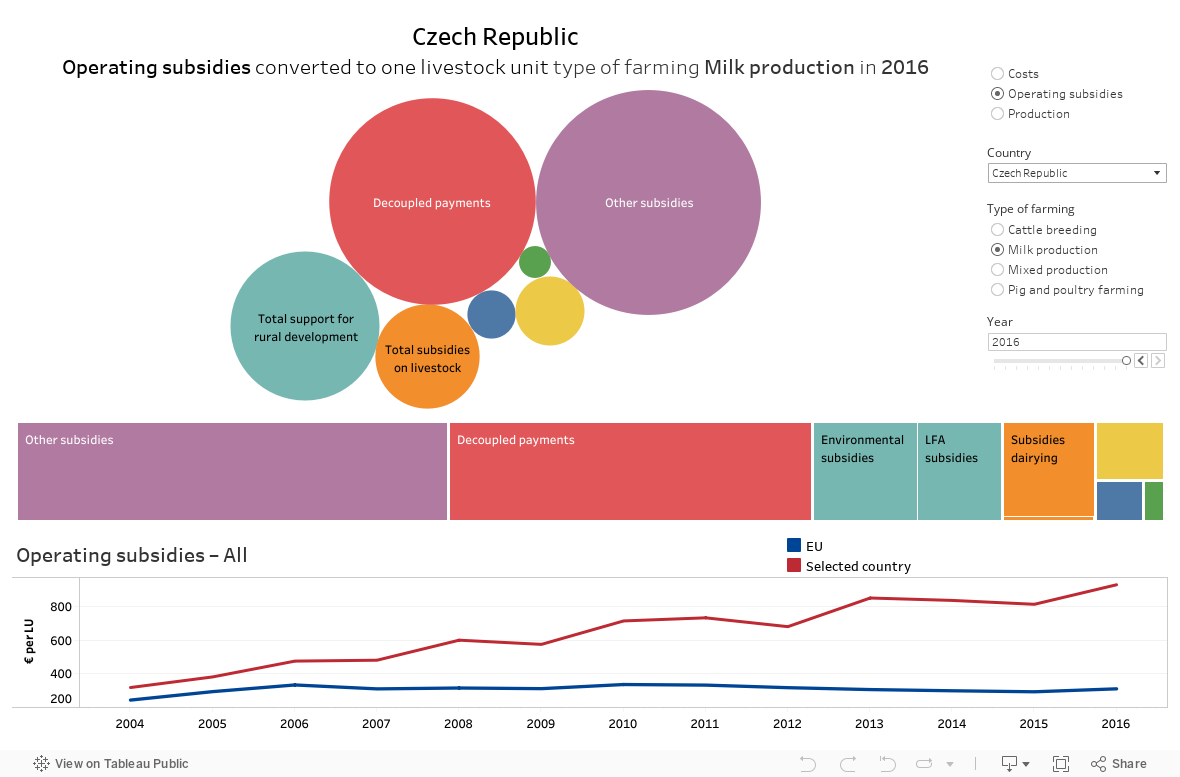
3. Composition of Selected Indicators.
The last visualisation shows the breakdown of indicators Total costs, Total production and Operating subsidies for individual Member States. You can compare the breakdown with the EU average.
Data source: http://ec.europa.eu/agriculture/rica/database/database_en.cfm